| This article explains who can access analytics in SchoolSpace, how to view them, and what kind of information you can track. |
Keep reading to learn about:
![]()
How to Use Analytics to Drive Impact
![]()
![]()
![]()
![]()
![]()
![]()
What are SchoolSpace Analytics?
SchoolSpace provides built-in tools that give schools visibility into how students and staff are interacting in a specific world. These insights help identify trends in participation, community engagement, and identify popular activities.
Analytics show how students are using a world - like how long they stay, what they click, and how often they visit. These insights help school staff support student engagement, plan better events, and show impact to school leaders.
Use Analytics to Drive Impact
SchoolSpace analytics can help you turn data into meaningful action. Here’s how schools are using these insights to support students and improve programming:
- Identify Disengaged Students for Proactive Outreach
Quickly see which students are logging in regularly and which ones aren’t. Track individual activity to understand who may need additional support, whether academically or socially. - Optimize Scheduling of Virtual Activities and Events
Use peak activity data to schedule events, clubs, or lessons when students are most likely to join and participate. - Evaluate Programs like SEL, Peer Tutoring, and Interest-based Clubs
See which events, experiences, or spaces have the highest participation, so you can double down on what’s working and adjust what’s not. - Demonstrate Platform Impact to School Leadership or Board Members
Export reports that highlight student engagement, social interaction, and overall platform use - making it easy to show how SchoolSpace is supporting your goals. - Tailor Supports by Grade Level or Cohort
Use usage trends to see how different student groups engage with the platform. Adjust programming and support to better meet their needs.
Who has Access to Analytics?
Analytics to a specific world are available to Managers and World Owners. If you are a school staff member who needs visibility into engagement or participation data but do not have Manager permissions, please contact your school's SchoolSpace administrator to request access or an exported report.
How to Access Analytics
Analytics are available inside the SchoolSpace Dashboard for World Owners and Managers.
To Access Analytics:
- Enter a world where you are a Manager or World Owner.
- In the left sidebar, click World Settings
 → Analytics
  .
. - The SchoolSpace Dashboard will open in a new tab and display the Analytics page from the world you entered in step 1.
- While in Dashboard, you can also view Analytics for other worlds. Click
 Worlds in the purple sidebar to view the list of worlds where you are a Manager or World Owner.
 - Scroll or use
 Filter Results to search for the world.
 - In the Actions column, click View Analytics
 to open the Analytics Summary tab for that world.
What You Can Track
SchoolSpace analytics offers insights into three core areas: Overall World Analytics, Asset Interactions, and User Activity.
Overall World Analytics
Available on the Summary tab, overall world analytics charts can be modified by a custom date and time range and exported.
 |
| Available Analytics | Description |
| Online Now | The total number of users in your world right now. |
| Sessions | The number of times an avatar dropped into your world. If a student in your world leaves and comes back later that would count as two sessions. |
| Average Session Length | The average time spent per session in the world. |
| Unique Users | The number of unique individuals who joined your world. |
| Asset Interactions | The number of interactions with an asset. Interactions could be an asset click, a video played, a zone entered, etc. |
To Export Overall World Analytics:
- For Sessions or Average Session Length, click View Table. For Unique Users, click View All. Follow the instructions below to export Asset Interactions analytics.
- Adjust the date and time range
 as needed.
 - Click Export
 in the upper left of the page to download a .csv file of the specified range.
Asset Interactions
For each interactive asset in your world (any asset that is configured with a link, media, zone, etc.), you can obtain counts grouped by the type of interaction. These analytics are found in the Asset Interactions tab. From here you can also see metrics of individual assets by clicking the View Table option.
The interactive assets you will see here are:
- Media Assets: Any video or audio that has been added under the Media section to an asset.
- Zone Assets: Any broadcast, private, or mute zone that has been added to an asset.
- Asset Links: Any link added to an asset under the link section to make it clickable.
 |
Asset Interaction Types
| Interaction Type | Description | Example |
| Audio (Link) Views | The number of times spatial audio attached to an asset as a link has been activated. Total and unique interactions are available in table view. | A YouTube video of water sounds that plays when you are near a fountain asset. |
| Video (File) Views | The number of times .MP4 files were played in your world. This will be anywhere you have used the Video Player (clean) asset. Total and unique interactions are available in table view. Average length of view is available for individual assets. | An instructional video that plays on a screen directly in the world. |
| Video (Link) Views | The number of times a spatial video link attached to an asset was played. This will be any video that automatically appears in a video tile when you get near the asset. Total and unique interactions are available in table view. | A YouTube video about birds that plays when you are near an asset of a bird. |
| Interaction Type | Description | Example |
| Broadcast Zone Entries | The number of times a Broadcast Zone has been entered. This will be any asset that automatically puts the user who steps on it on Broadcast All or Broadcast-Near. | A podium asset that when stepped on puts the presenter on Broadcast All. |
| Private Zone Entries | The number of times a Private Zone has been entered. This will be any asset that is limited to a certain number of participants. | An office set up for only two users to have private conversations. |
| Mute Zone Entries | The number of times a Mute Zone has been entered. This will be any asset that when stepped on will automatically mute all microphones. | A meditation area set up for quiet reflection. |
| Interaction Type | Description | Example |
| Portal Tooltip Opens | The number of times a portal asset has been clicked in a specific world and the pop up message “Leave this world and portal to (world name)” has been displayed. Portals allow users to jump from one World to another. | A portal that takes students from their classroom world to a Middle School Social Hub. |
| Teleport Tooltip Opens | The number of times a teleport asset has been clicked in a specific world and the pop up message that says “Teleport to another location in this world?” has been displayed. Teleports allow users to move from one location to another in a world. | A teleport on a directory sign that takes students from the front of the building to a specific counselor’s office. |
| Text Modal Opens | The number of times a custom text message appears when an asset is clicked. | A custom list of announcements that is shown when students click an announcement sign. |
| Uploaded Image Modal Opens | The number of times a custom uploaded image was displayed when a student clicked on an asset. | A flyer about an upcoming art competition that shows when students click on an art easel. |
| Website Modal Opens | The number of times any external website that opens either in the modal iframe (center of the screen) or drawer iframe (left side of the screen) was clicked. | When students click on their school logo, the school’s website opens. |
| Drawer or Page Opens | The number of times any SchoolSpace application drawer or page was opened when the asset is clicked. | When an asset of a map is clicked, the SchoolSpace world map drawer opens. |
To View or Export Asset Interactions Analytics:
- Click the Asset Interactions tab near the top of the page or, from the summary page, click View All on the Asset Interactions card.
- This will open the Asset Interactions page where you'll find cards for each type of interaction. Click the asset interaction types below for descriptions and examples of each interaction type:
- If available on the card, click View Table to open a detailed table of interactions broken down by asset. You will see the following columns:
- Details: The name of the asset. If the asset has a unique name, you will also see that listed here.
- Interaction Type: The kind of interaction that occurred.
- Total Interactions: The total number of interactions that occurred during the date range.
- Unique Interactions: The number of interactions per unique user.
- Actions: Click View Detailed Analytics
 to open charts for this asset's Total Interactions and Unique Interactions.
- Adjust the date and time range as needed.
- Use Filter Results as needed to view or export data for a specific asset.
- Click Export in the upper left of the page to download a .csv file of the specified range and/or asset.
SchoolSpace analytics are fairly extensive. Keep in mind that you may not use all of the asset interaction types, and that’s ok!
User Activity
The Users tab shows a table of individual activity for each user in a specific world, within the time range you select.
 |
| Column Heading | Description |
| Last Entered | The date the user last entered the world you are viewing. |
| Total Visits | The number of times the user has entered during the specified time period. |
| Media Views | The total number of times the user has engaged with media (uploaded or linked) in the specified world. |
| Link Clicks | The total number of times the user has clicked on an asset in the specified world. |
| WebRTC Connections | The number of times the user has connected with another user over spatial video in the specific world. |
To View or Export User Activity Analytics:
- Click the Users tab near the top of the page.
- Adjust the date and time range as needed.
- Use Filter Results as needed to view or export data for a specific user.
- Click Export to download a .csv file of the specified range and/or user.
User Session Analytics
Get detailed information about who was present in the world and how long they stayed. Moderators, Managers, and world Owners can use this to track attendance.
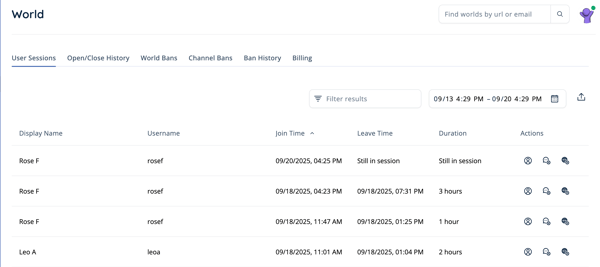 |
| Column Heading | Description |
| Display Name | The name displayed above a user's avatar. Student Display Name is typically First Name + Last Initial. |
| Username | The SchoolSpace username for the user. |
| The email address associate with the user's SchoolSpace account. Moderators see email domain (format: ****@example.com). Managers and World Owners see full email addresses. | |
| Join Time | The date and time the user joined the world |
| Leave Time | The date and time the user left the world. If the user is still in the world, you will see "Still in session." |
| Duration | The length of time the user was present in the world. If the user is still in the world, you will see "Still in session." |
| Actions | Actions you can perform such as: View the user's profile, ban or unban them from Chat Channels, or ban or unban them from the world. Learn more about these Safety Actions. |
To View or Export User Session Analytics:
- Enter a world where you are a Moderator, Manager, or world Owner.
- In the left sidebar, click World Settings → User Sessions .
- The SchoolSpace Dashboard will open in a new tab and display the User Sessions page from the world you entered in step 1.
- Scroll, use Filter Results to search for a user, or adjust the date and time range to find the session data you need.
- If necessary, click the Load All Results button.
- Click Export to download a .csv file of the specified range and/or user.